- Products
By use case

Industry
Read how companies in automotive, aerospace, telecommunications and medical fields use Red Pitaya.
Academia
All about how Red Pitaya can help professors teach more efficiently and students learn with ease.
Research
Red Pitaya is an essential component of many scientific research projects in the fields of physics, communication, materials and bioscience.

Radio Amateurs
If you are looking to get into Software Defined Radio, look no further than SDRlab which was developed specifically with this use in mind.
- Applications
- Documentation
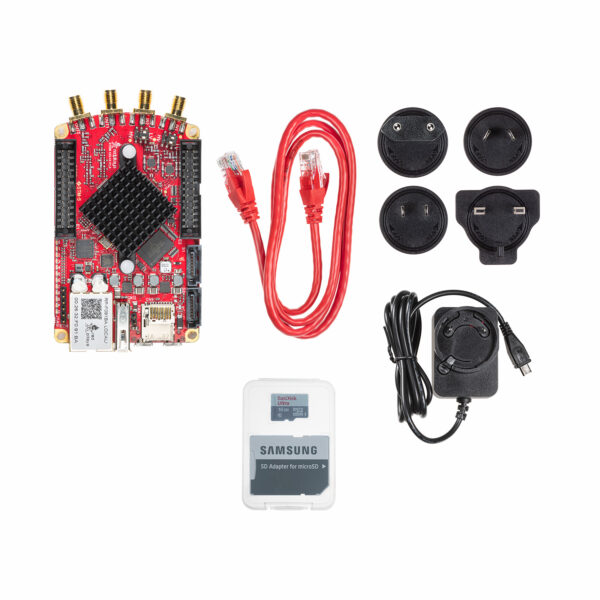
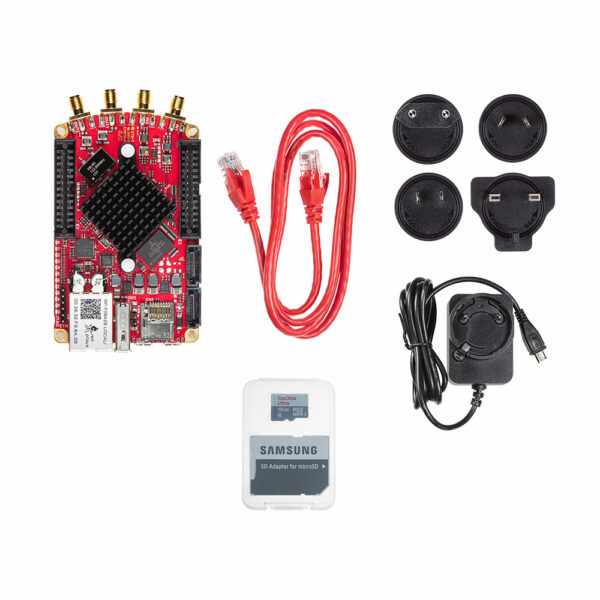
Technical Documentation
Find the information about getting started, more about applications and the developers guide here. Update your OS here.
Student projects
Check out what epic student projects have already been done with Red Pitaya.
Teaching materials
Explore our library of step-by-step examples, video tutorials and advanced FPGA exercises.
User forum
Engage with Red Pitaya's community of users and exchange ideas.
- About
- Blog